
Download the extractor and the guide to run over your Swift project.
Run this tool to your Swift project and use the generated metadata file into the visualizer to view your project as a city!
Download the Extractor!
Download the extractor and the guide to run over your Swift project. This tool extracts information from Swift projects, which are then visualized as cities.
Run The Visualizer!
Presents information about Swift projects in 3D using the Software as Cities metaphor. Accounts for the many types of modules that exist in Swift and presents them as buildings.
Cities!
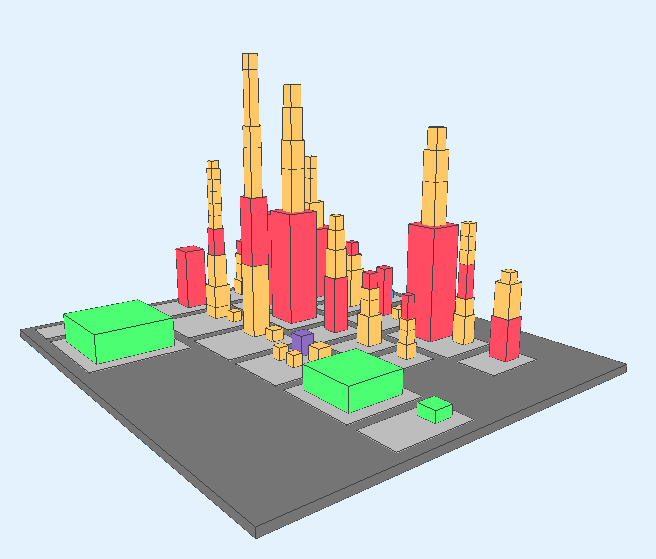
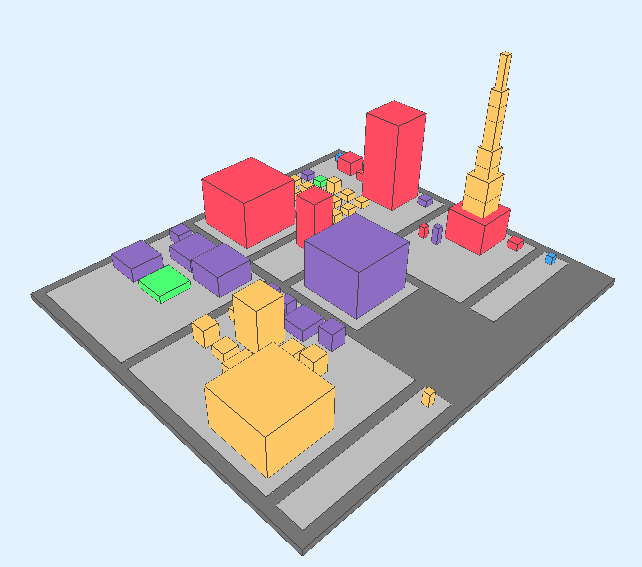
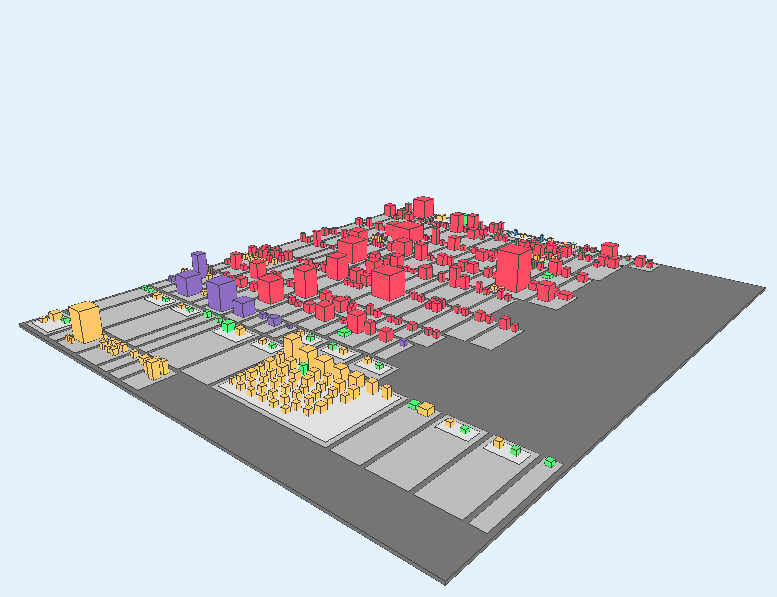
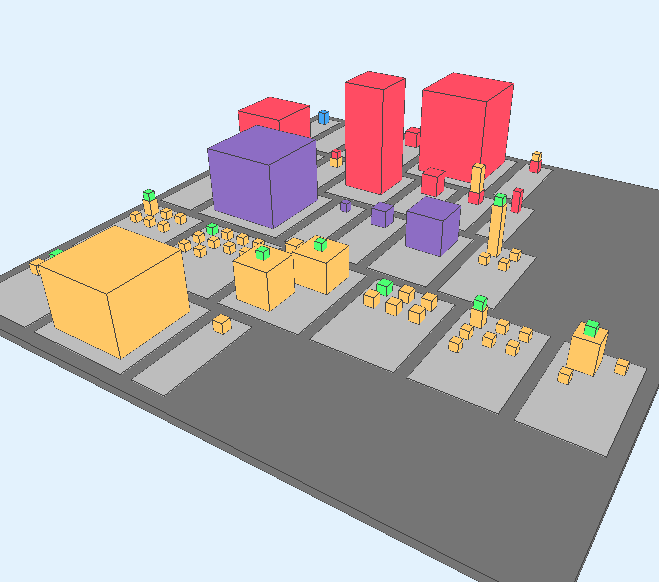
We took open source projects and visualized them using our tool. See the cities below for some of the most starred Swift projects in GitHub.
CVCalendar, Alamofire, RxSwift, Animated-Tab-Bar, Async, Cartography, Perfect, SnapKit, Spring, Swift JSON.

Try it yourself!
Take the samples used for these views above and run it yourself using the Visualizer tool! Download here.
What is the City Metaphor?
Introduced by Wettel (2007), the City Metaphor proposes to analyse and view software systems as cities. The software system is represented as a city that can be traversed and interacted with, provinding the viewer a sense of locality to ease program comprehension. The key point in conceiving a realistic software city is to map the information about the source code in meaningful ways in order to take the approach beyond beautiful pictures. It proposes several concepts that contributes to create the urban feeling, such as appropriate layouts, topology, and facilities to ease navigation and interaction.
How does the Visualizer look like?
A simple demo reveals you the view and application interface!
GitHub
Look forward our organization on GitHub!
How does the Extractor work?
We use two tools to collect and generate the data that will be visualized. The first is a custom Xcode toolchain that exports an AST representation of the project to an output file, by using the -dump-ast command of Swift's compiler. We then use another tool to parse the AST representation and allow its visualization.
Metaphor applied to Swift
This project proposes its own way to translate Swift systems into the city metaphor, which allows the understanding of the usage of the language particularities.
Check out here an extended abstract that explains in details the project and its challenges.
The buildings in the city
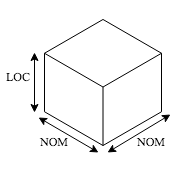
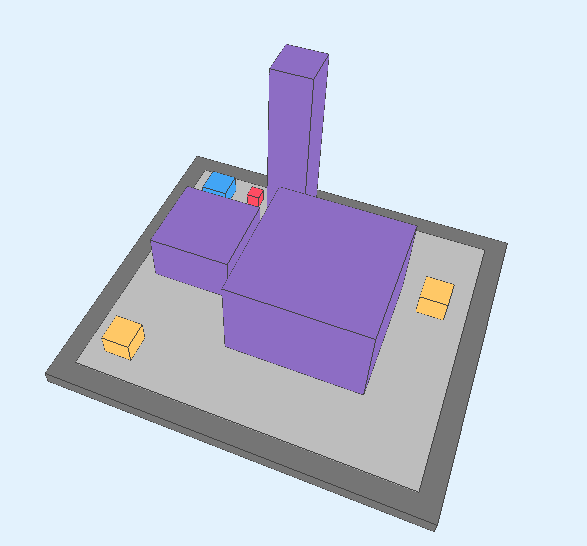
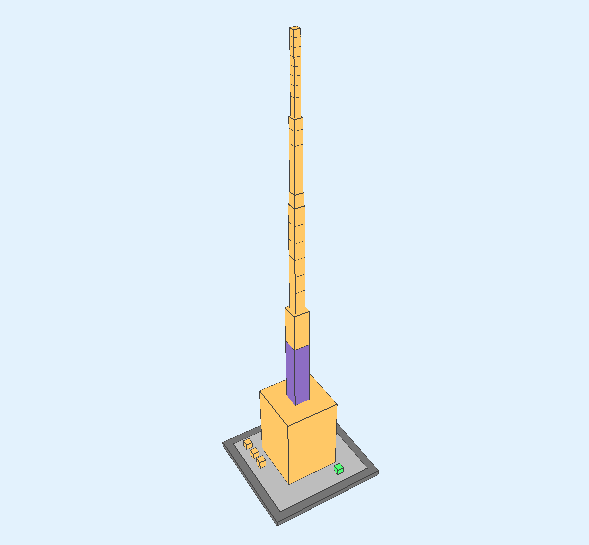
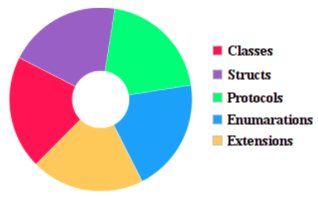
A block is the fundamental element of the metaphor, representing a city building. In the original metaphor, a block was mapped to represent a class of the system. However, Swift has several elements that must be represented that were not available in Java or Javascript (e.g., structs and extensions). In a Swift context a block can represent one of these types: Classes, Structs, Protocols, Enumerations or Extensions. Several metrics can be applied in order to define the measurements of a block. For this work, the block height is given the number of lines of code (LOC) of the element, while the width and length are defined by the number of methods (NOM).
The colors of the objects
We decided to differentiate the types of elements by using different colors for each kind since, according to Zanolie, forms are usually associated with the representation of elements of different nature, yet all elements are Swift types that belong to different categories. Moreover, the use of different forms would go against the metaphor, translating the elements into objects that do not necessarily create the immersion of a city.
The city Topology
The city topology is usually mapped to elements of the system hierarchy. Since there are no packages, namespaces or anything equivalent in Swift, the mapping limits itself to two clear levels: the project and the files. The lowest layer represents the city limits as being the whole project (dark gray), and each element of the second layer represents a district, which translates to a file within the project (light gray).
Handling extensions
A challenge was how to represent the relations between extensions and other elements. Two approaches were considered satisfactory:
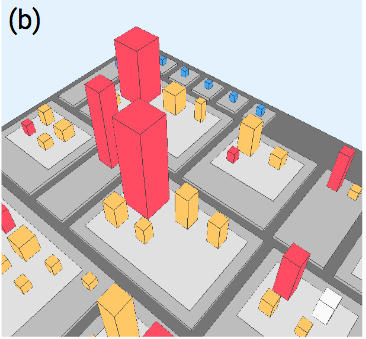
- a) Stacking extensions to the element, so they would become a single building.
- b) Adding another layer that would contain the element and its extensions.
There are, however, advantages and disadvantages of each. The first, for example, better translates the complexity of the elements. On the other hand, the second allows a cleaner view as the city elements are more spread.
Simple analysis
Using our Visualizer you can quickly make analysis and conclusions about the project just spending a few minutes looking at the city. Look some analysis made bellow:
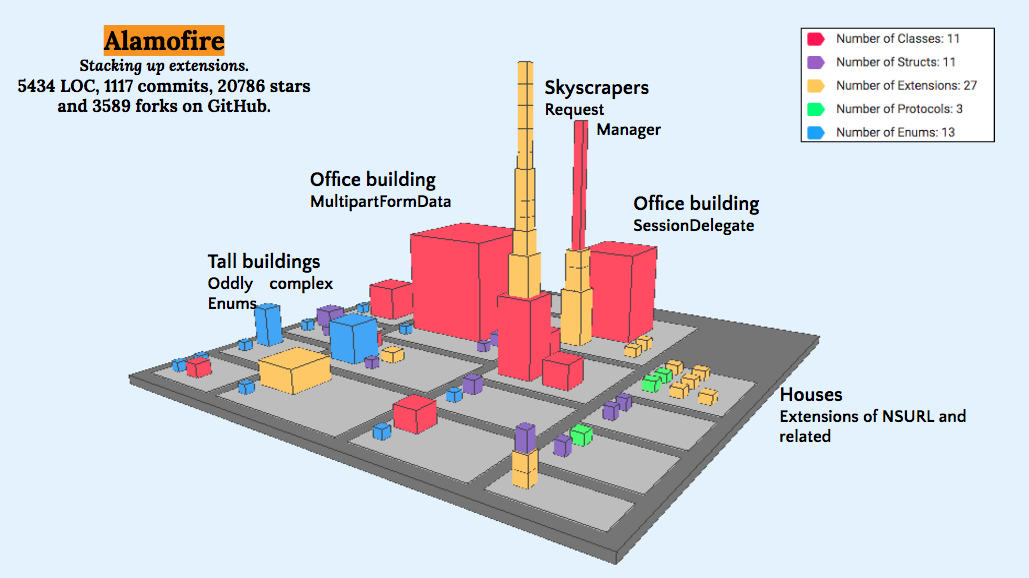
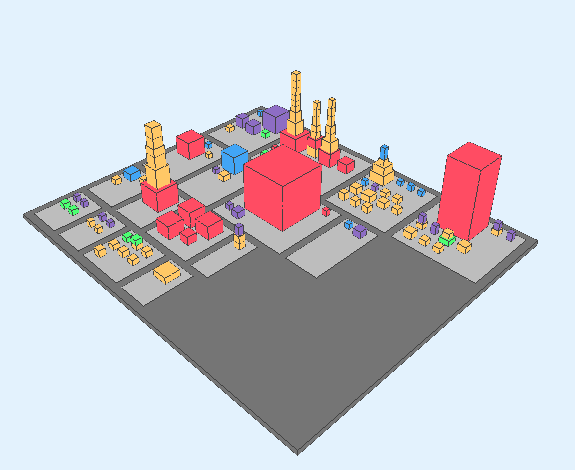
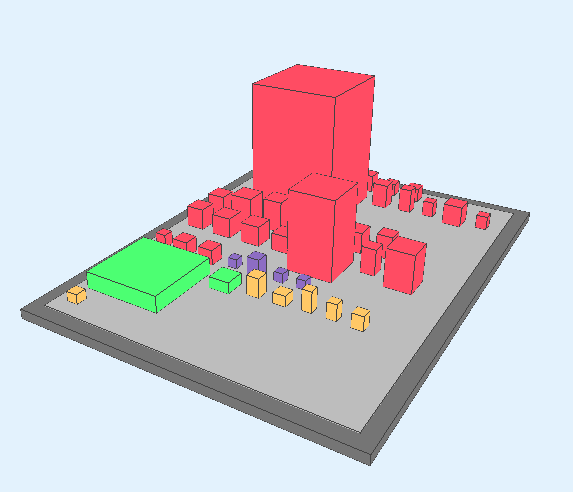
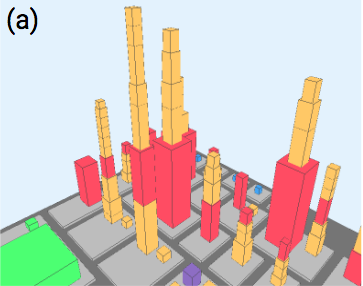
Alamofire: API for HTTP networking.
- Extensions as a pattern, but there are some huge classes in the city.
- Two strangely large blue towers (enums). This is unusual for enums. Therefore, they could be subject to inspection.
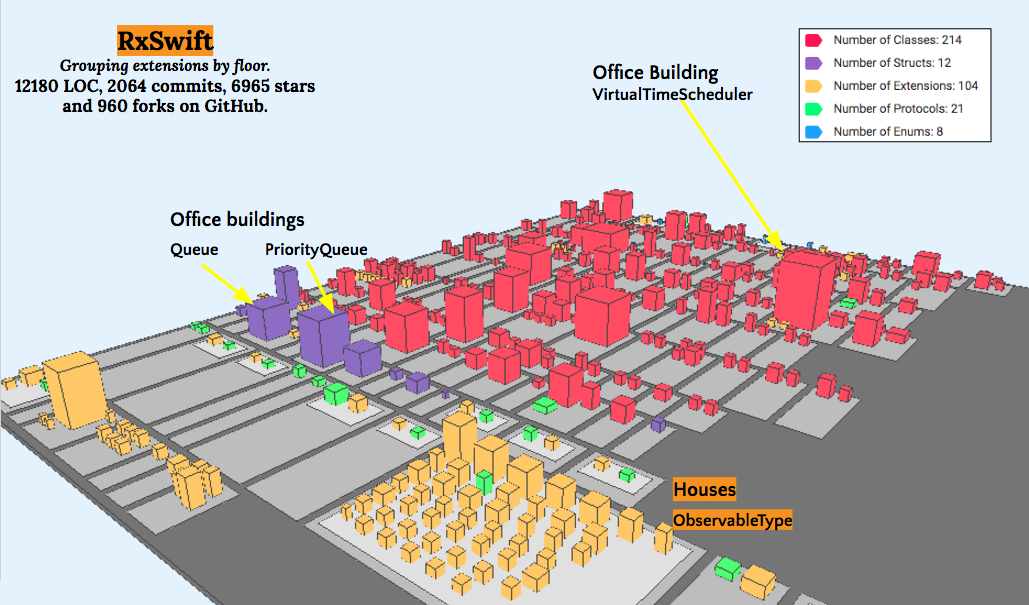
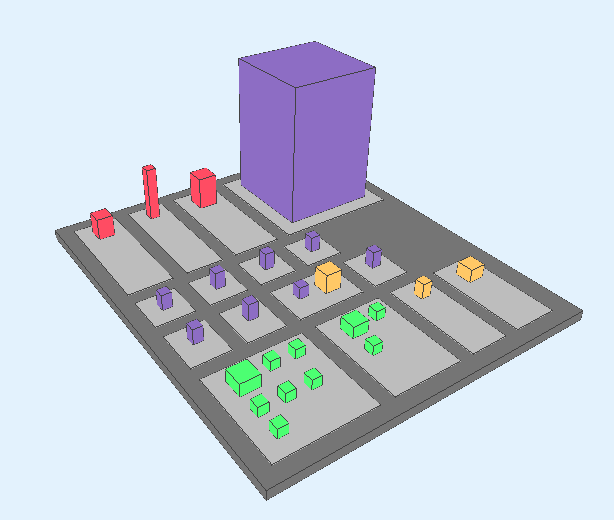
RxSwift: reactive programming framework.
- Few extensions that extend classes;
- More extensions to native Swift types, shown as ungrouped yellow blocks in the city;
- 53 extensions to a protocol (ObservableType);
- Structs are not as often used as in Alamofire.